The difference between spectroscope, spectrometer and spectrophotometer
The broad field of spectroscopy is already complex enough as-is. It doesn't help that there is an abundance of different terms describing the world of the associated measuring instruments. This article is intended to provide a little overview of the most common terms used in the field.
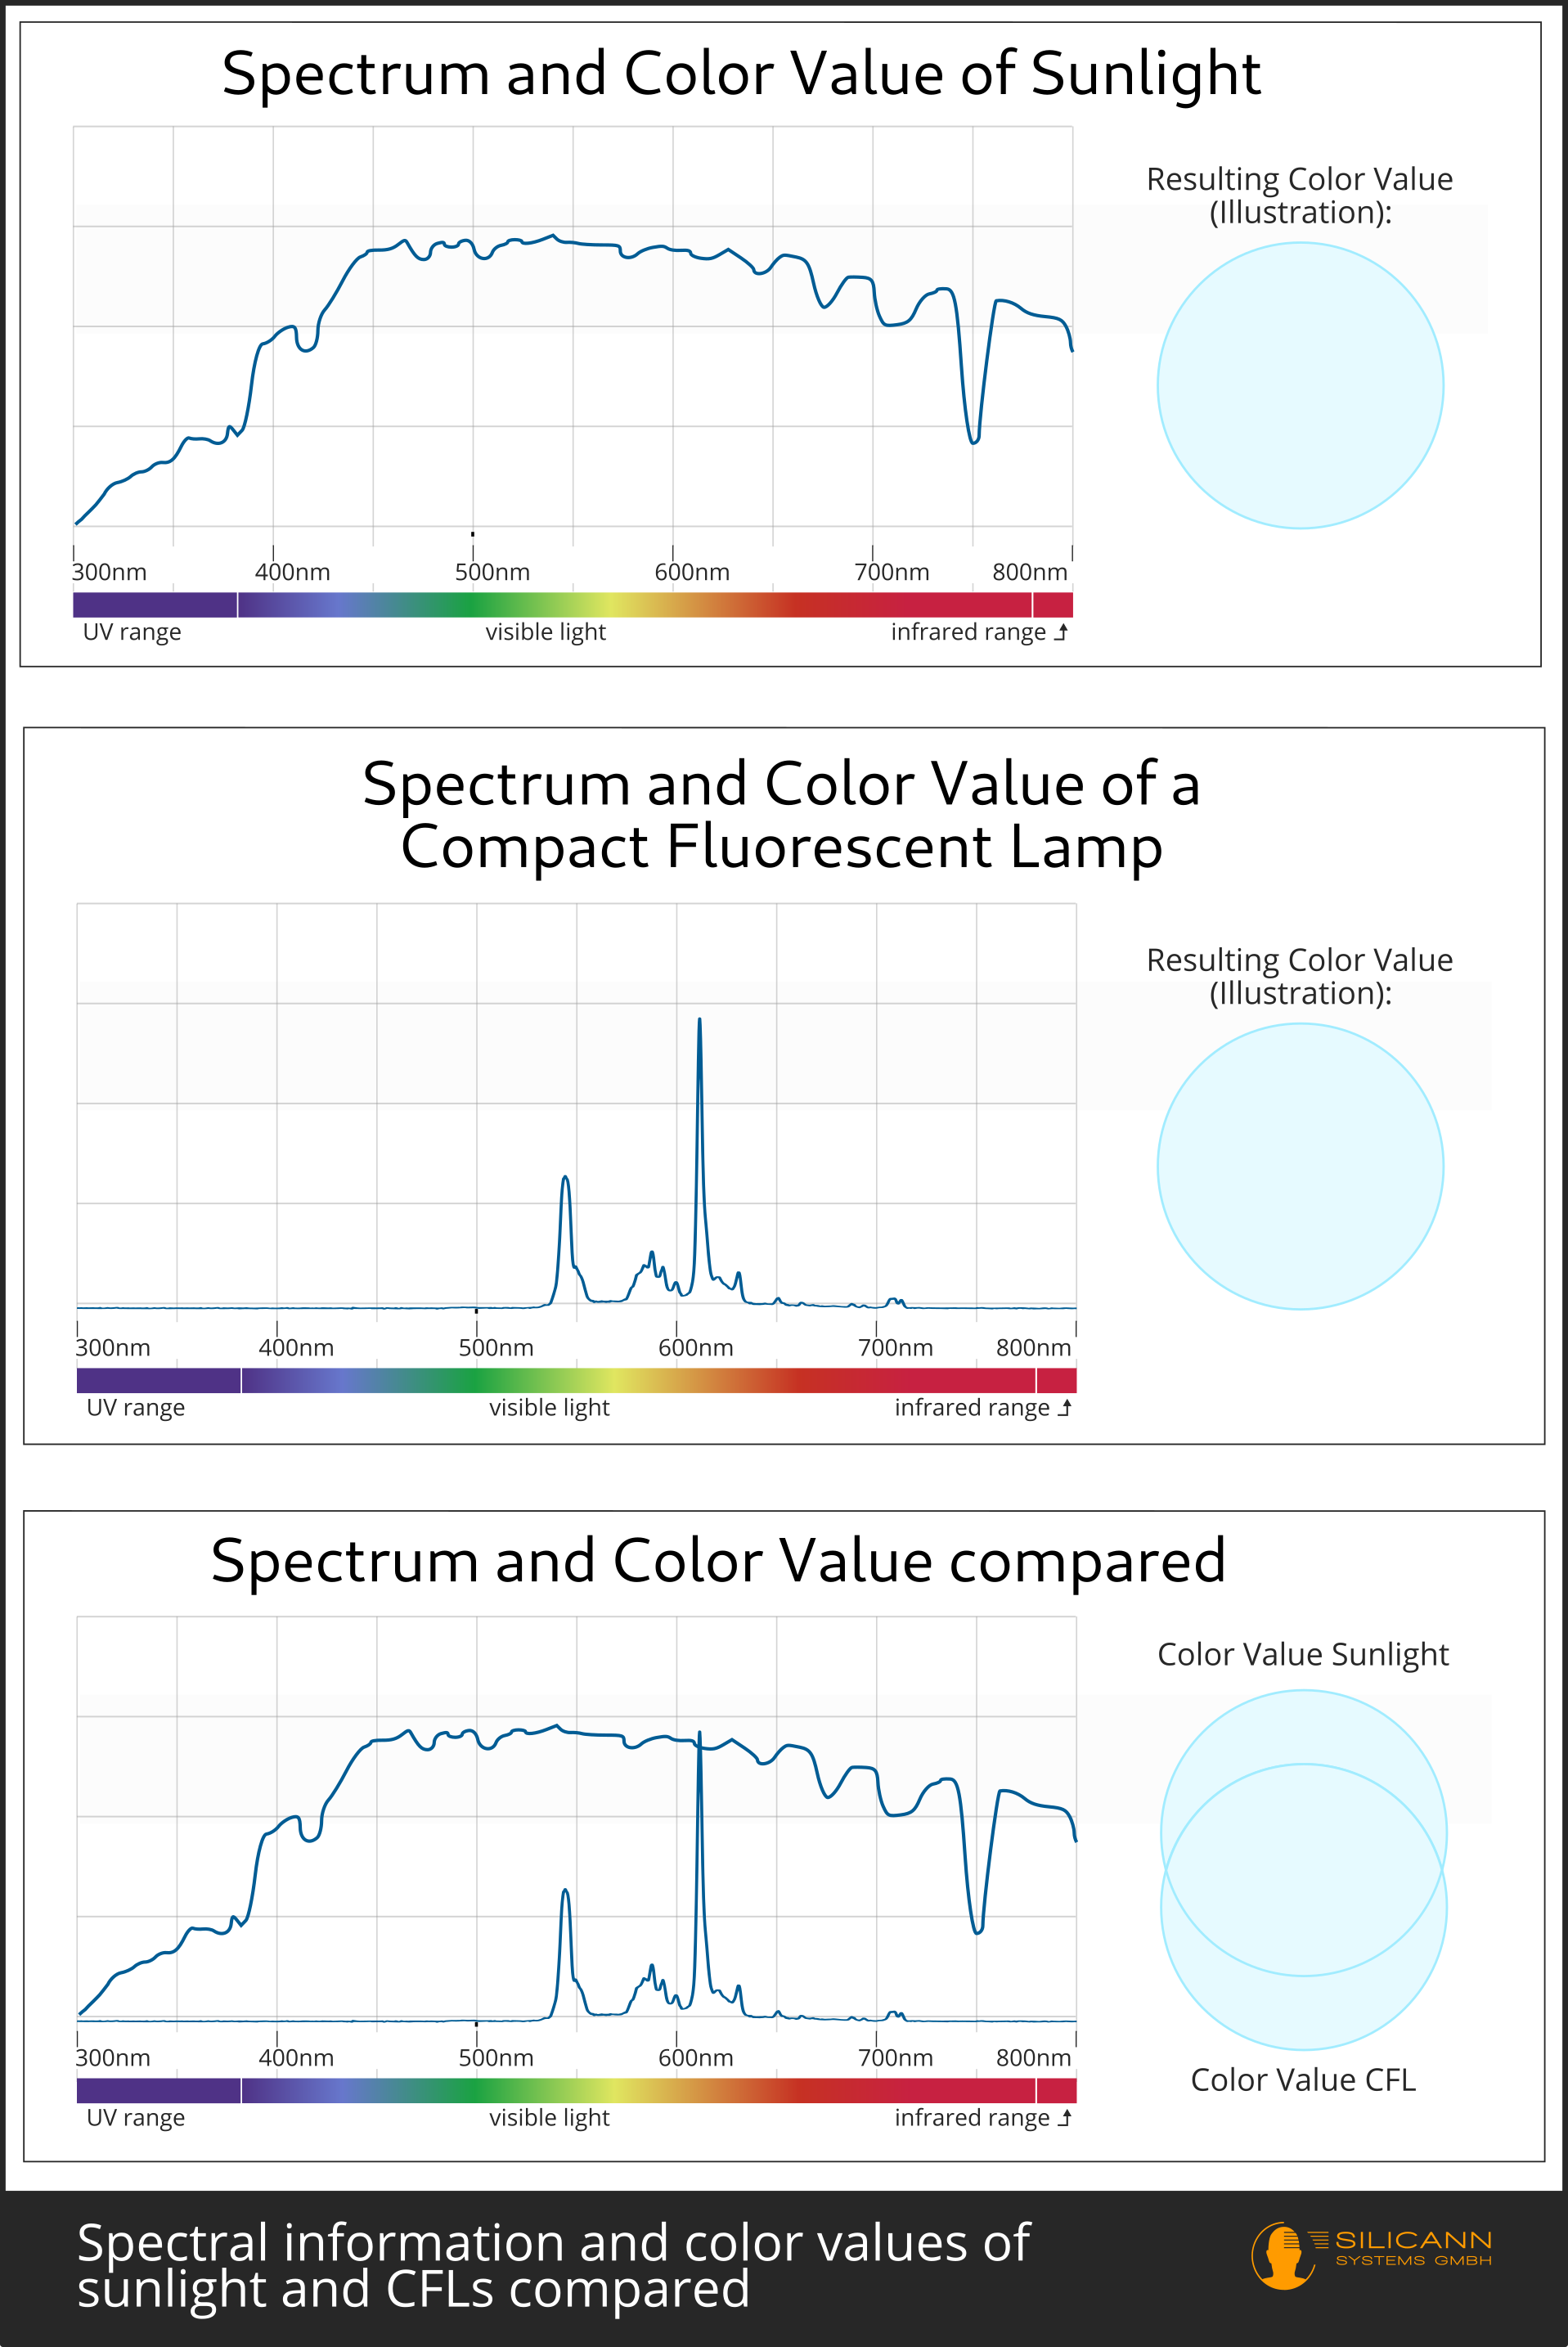
Generally, all different devices deal with evaluating spectra. A spectrum describes the composition of the frequencies of a signal. Let us take the example of light: while our eyes are only able to perceive color impressions, the radiation actually consists of a multitude of different rays with different frequencies. The color impression results from the simultaneous impact of all these different rays on our retina.
A spectroscope breaks down radiation (e.g. that of the sun) and makes the result, a spectrum, visible for the observing person. The typical result is an absorption spectrum: a rainbow in which parts have been replaced by black stripes at particular positions.
Spectroscopes were the first major step in the history of the technology of analyzing spectra. A lot of information can already be obtained from the presence or absence of certain spectral lines. The following picture shows the spectral lines of hydrogen and those of the sun. On closer inspection it can be seen that all lines of hydrogen are also present in the spectrum of the sun. Apparently the sun must consist partly of hydrogen:
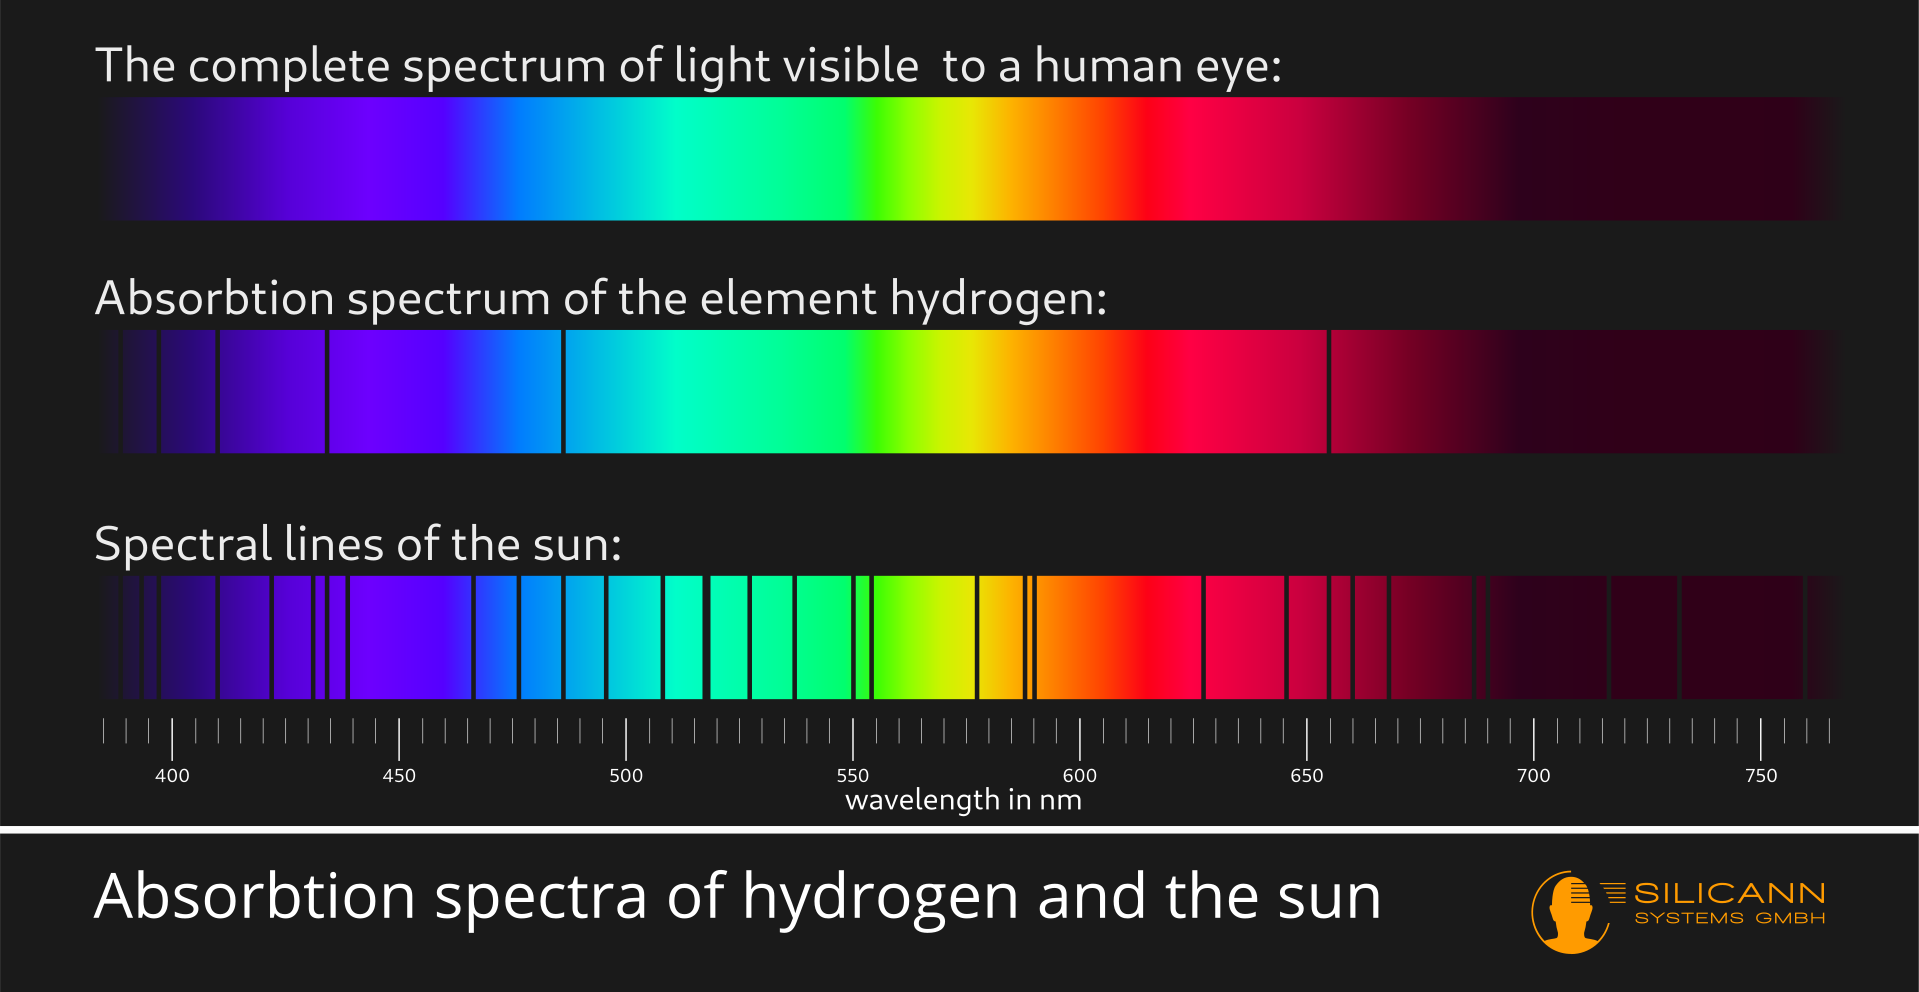
And in fact hydrogen makes up over 90% of the sun's mass. The extra lines in the sun's spectrum are a result of the presence of other elements like helium, oxygen and carbon. Spectroscopes are still important tools for astronomy today.
However, there is a limit to the gain in insight: Although one can infer the presence of e.g. hydrogen from the spectral lines, we can't see the amount of the respective substance. The spectral lines of hydrogen always look the same, regardless of whether the sun consists of 9% or 90% hydrogen. Both the position of the lines in the spectrum and their different widths only say something about the nature of the elements and molecules. However, the lines do not change their shape or position with higher or lower amounts of this substance.
This is the difference to spectrometers. Spectrometers not only provide information about whether a certain substance is present, but also how much of it was measured. In other words: For a specific measuring range, spectrometers indicate how great the radiation intensity is at the respective observed wavelength. This also makes it possible to make statements about different quantitative ratios. For example, you could dissolve an unknown amount of sugar and salt in water and then find out the exact exact sugar and salt proportions in the sample with the help of a spectrometer. Indeed, that way e.g. liquid foods such as oils are inspected for presence of possible harmful substances during production.
There are spectrometers in many different designs and for different radiation ranges of the electromagnetic spectrum, as well as for particle radiation. The light that is visible to us also belongs to the electromagnetic spectrum. Spectrometers measuring the visible light (and the bordering ranges of near ultraviolet radiation on the one end and infrared radiation on the other) are usually referred to as spectrophotometers. So spectrometer is the more general term that describes all measuring instruments, and spectrophotometer is a specific form of spectrometer.
As a mnemonic: spectrophotometers are for radiation you can make a photo off, i.e. visible light.
How does a spectrophotometer work?
When measuring with a spectrophotometer, a light source must first be available. Either one actually wants to measure a light source (e.g. the sun, or a freshly produced LED or something similar), or the material to be measured gets shined through (e.g. transparent liquids), or one e.g. illuminates a surface and then analyzes the reflected light.
This incident radiation must now be fanned out, i.e. equally divided according to wavelength. The spread spectrum is then measured individually, wavelength by wavelength. The result is the respective radiation intensity for each measured wavelength range.
In practice there are two different types of spectrophotometers: Either the fanned out wavelengths are measured individually, one after the other, or the entire spectrum is recorded at once.
With the so-called single-beam spectrophotometers, the individual sections of the spectrum are measured one after the other. The light is e.g. guided by a prism, with visible light this results in the well-known rainbow pattern. Behind the prism there is a very narrow slit that only lets a small part of the spectrum pass. The prism and slit together are called monochromator. At the end of the light path there is a photocell that measures the number of incoming photons.
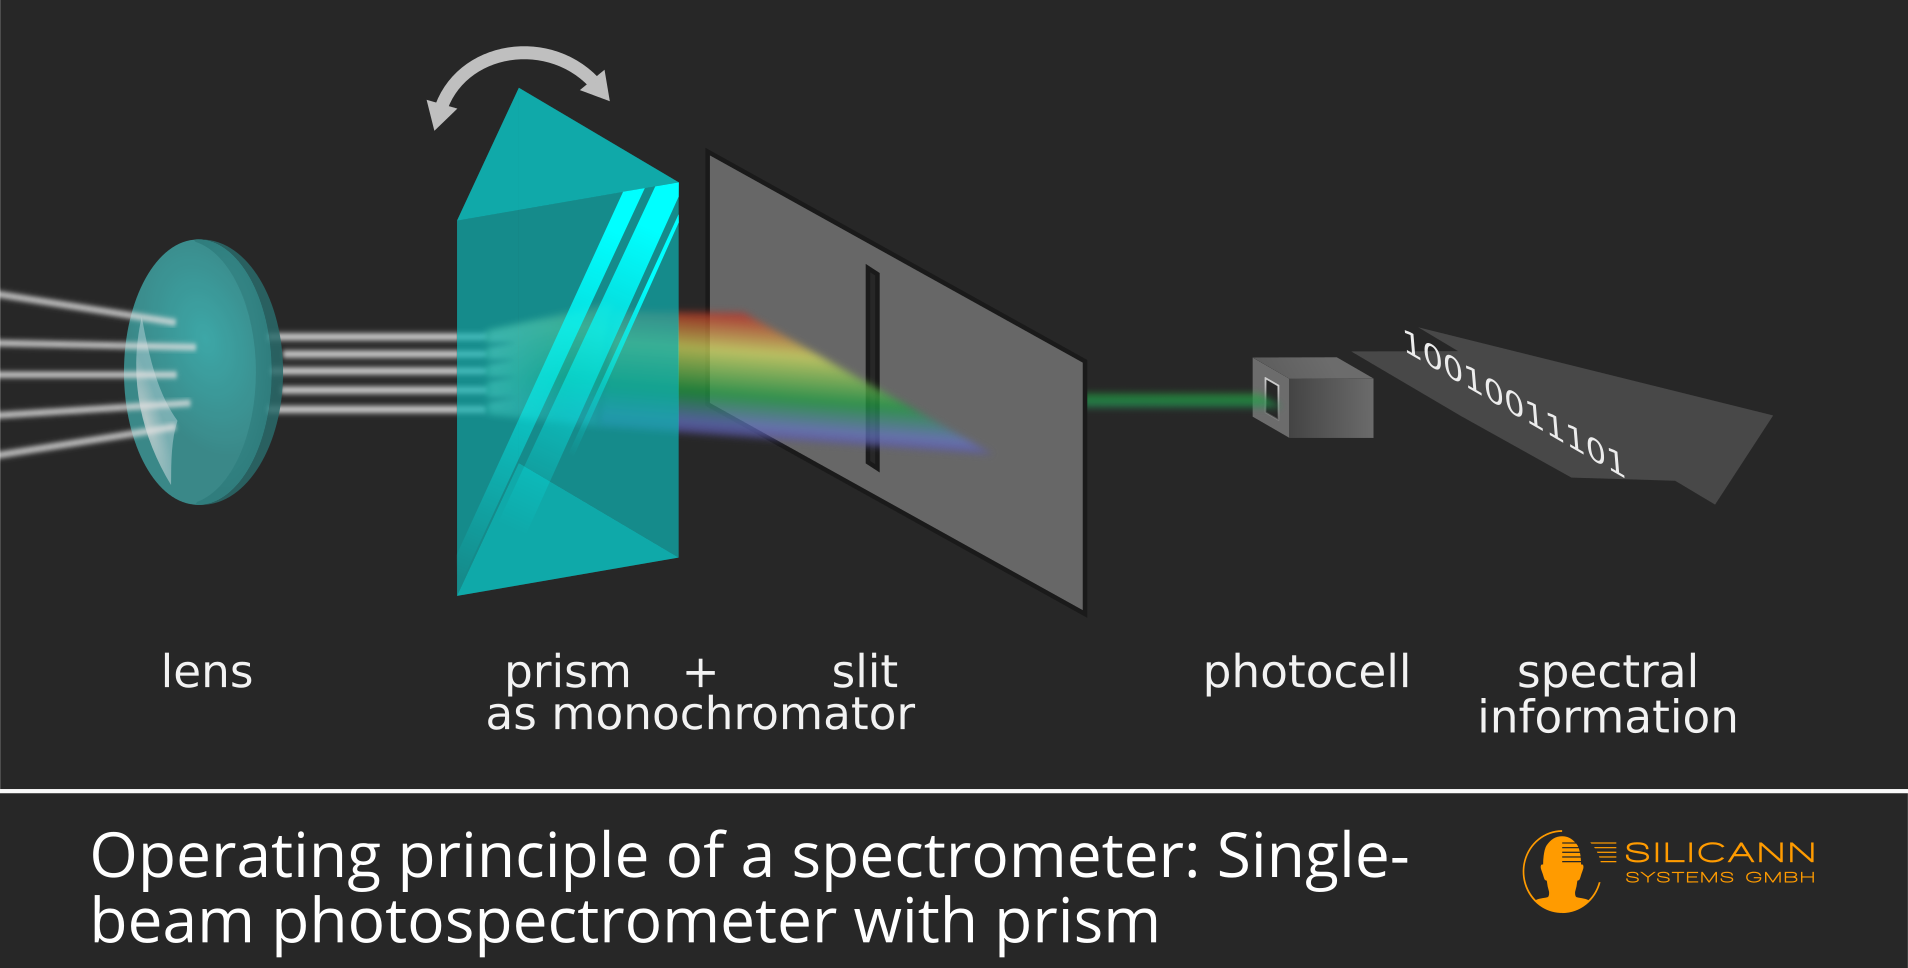
The highlight: the prism can be rotated. That means the rainbow spectrum also rotates, so a different part of the light passes through the slit and reaches the photodiode. In this way one can examine the entire spectrum step by step.
Alternatively, instead of prism and slit, other optical devices can be used to ensure that only a specific, as narrow as possible, part of the spectrum reaches the photodiode. A possible but usually more expensive option would be a variable bandpass filter. This is a seemingly transparent pane treated in a special way, which only lets a certain wavelength pass at each particular point. By moving the bandpass filter back and forth it is thus also possible to determine the radiation intensity for particular wavelengths.

There are also so-called double-beam spectrophotometers. These devices work in much the same way, but there is a second light path that does not shine through the transparent object being measured. Instead, there is a reference material in the path of the second beam, the exact nature of which is known. This allows the measurement results to be compared with the reference values. If the measured results don't match the expected results for the reference material, the measurement of the actual material of interest can be adjusted automatically. This enables higher levels of accuracy overall.
The great advantage of single-beam or double-beam spectrophotometers is the achievable accuracy. This makes them particularly interesting for laboratory applications. The highest possible precision, however, comes at the price of low measuring speeds: Since the individual wavelengths can only be measured one after the other, a complete measurement cycle takes longer to complete, especially for higher resolutions, i.e. more narrow bandwidths. Readers with an engineering background immediately recognize another disadvantage: There are moving parts involved, and thus a potential source of wear and tear.
The alternative design is called a diode array spectrophotometer. In these devices there is not just a single photodiode, but a whole row of identical diodes next to each other. Here the fanned out light spectrum is not limited using a diaphragm. Instead, the entire spectrum reaches the sensor array at the same time - and is thus also measured at once.
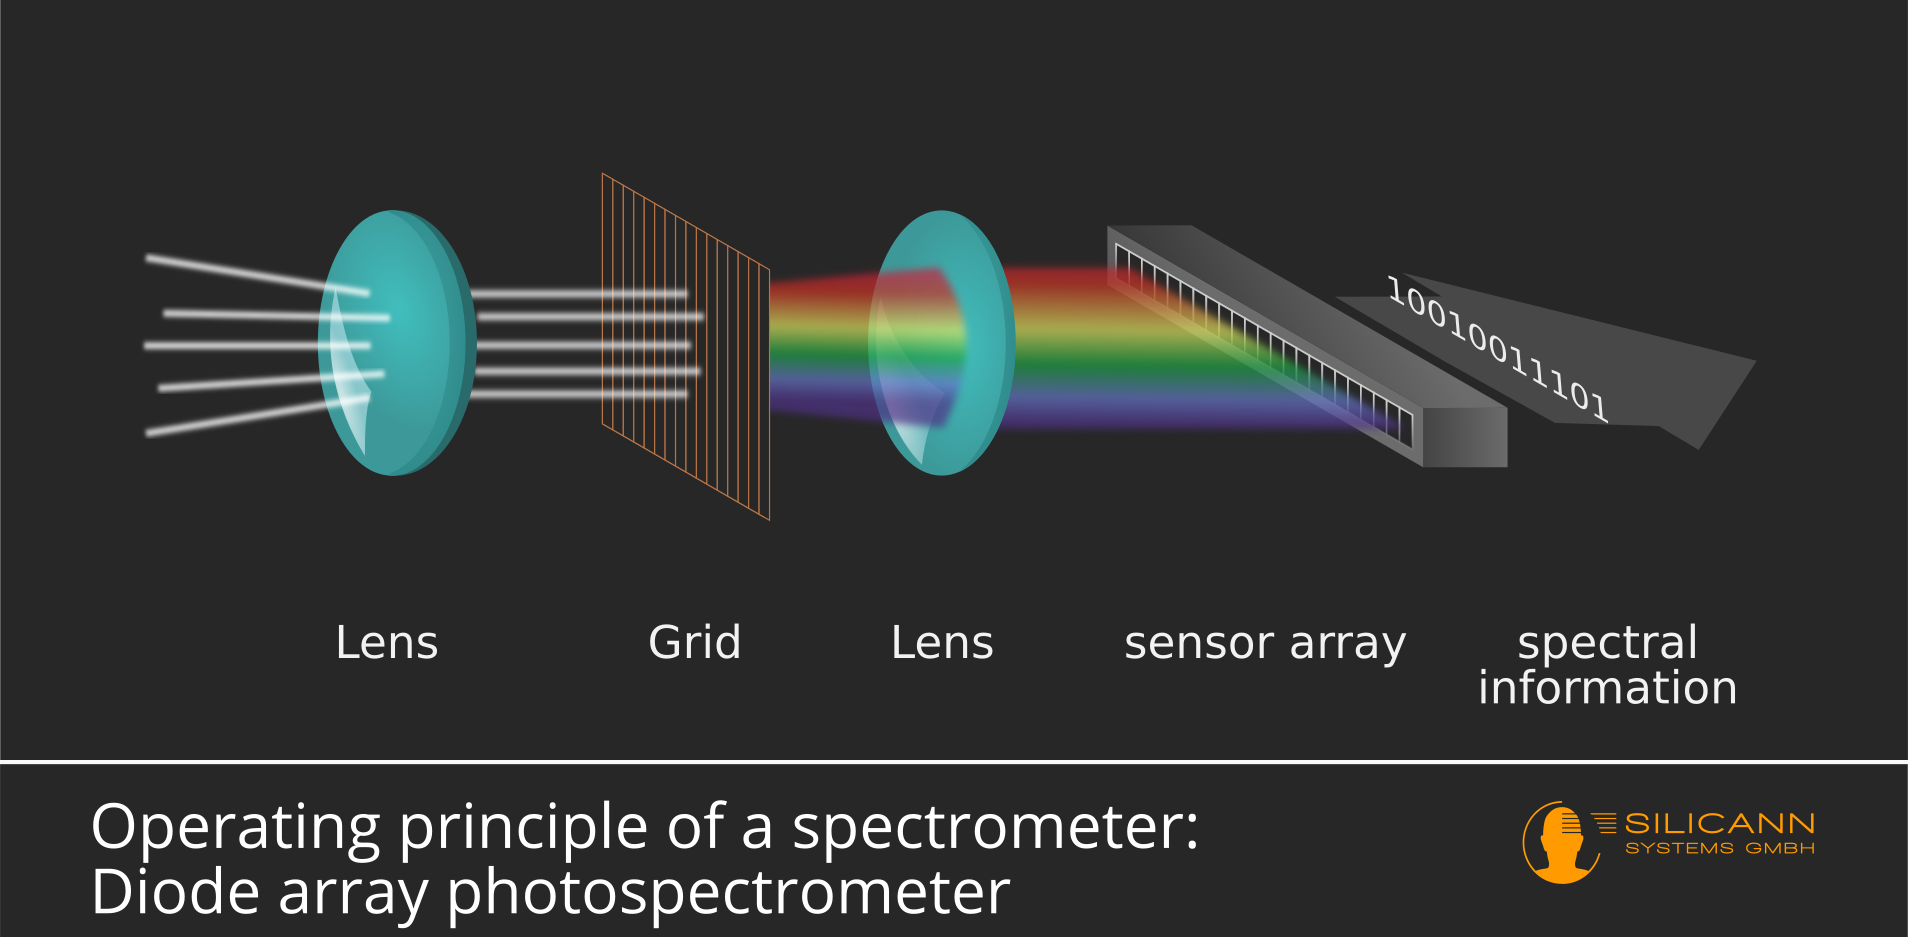
The missing arrows in the picture give a clue: there are no moving parts here. In addition to being robust, this approach has the additional advantage of allowing the construction of very compact devices. And compared to diode array spectrophotometers, the results for the entire measuring range are available at once, wich translates to significantly higher measuring speeds in the field. The disadvantage of this design: As a rule, the spectral resolution is lower than with single or double-beam spectrophotometers.
There is therefore no one optimal spectrometer. Depending on the application, either high precision or high speed is required. In a laboratory situation it usually isn't that important whether a measurement takes 0.02 or 0.2 seconds. Instead, the maximum resolution is usually required here in order to achieve results at the limit of what is possible.
In production, on the other hand, things are usually faster and rougher. Here chemical color changes are observed continuously, or products on conveyor belts passing the measuring head at top speed are inspected for adherence to target values. In these cases, a robust measurement variant is often found in advance, which then runs reliably, quickly and above all continuously, during production. This is a situation where diode array spectrophotometers can shine.

